BEST PRACTICES · CASE STUDY
How EyeCloud.ai became the official ISP tuning partner for the sensor modules of an Intel co-developed AI vision developer kit — turning six raw image sensors from four vendors into cameras developers can trust out of the box.
EyeCloud.ai served as the official ISP tuning partner for the camera sensor modules of an Intel co-developed AI vision developer kit (project “D”). Using a standardized calibrate → tune → validate workflow and Imatest-based lab measurement, six image sensors from four vendors (Sony, SmartSens, OmniVision, ON Semiconductor) passed all defined image-quality criteria — including color error ΔC 2000 mean < 5 under D65, SNR > 38 dB at 500 lux, and MTF50 ≥ 0.3 cycles/pixel — enabling Intel to offer its developer ecosystem production-ready image quality out of the box, with a verified tuning profile and IQ report for every sensor.
01 · The Case
Intel’s AI vision developer kit lets customers choose the camera module that fits their product. That flexibility created an image-quality challenge: every optional sensor module had to look equally good — or the dev kit experience would vary by sensor choice.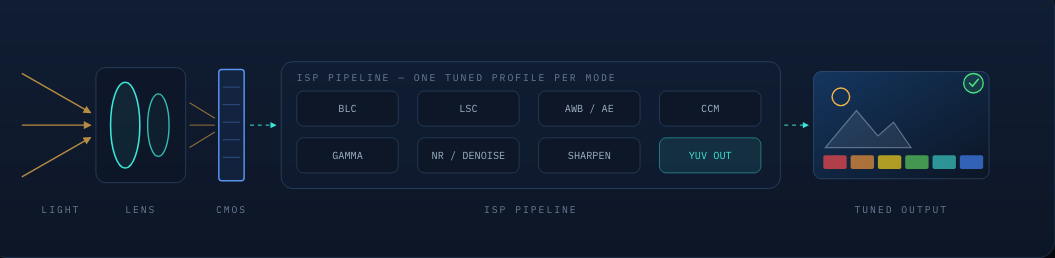
EyeCloud.ai acted as the official ISP tuning partner for the kit’s sensor modules. For each sensor we executed the full bring-up → calibration → tuning → verification flow and shipped:
Result: Intel gained a sensor menu where every option meets the same measured quality bar.
Why it matters: a development kit is judged by its first preview image. Consistent, tuned image quality across all sensor options removes a whole category of integration risk for the end customer — that is what “official tuning partner” delivered on this program.
02 · The Workflow
The same repeatable flow we apply to every tuning engagement — sensor-agnostic, documented, and auditable at every gate.
Adapter & driver settings; black level, min/max gain and exposure-time characterization.
Base configuration loaded to the ISP on an EVM board; preview up to 1080p@30fps for live checks.
Lens shading & white-point calibration on a golden module against D65/CWF/TL84/A sources.
Golden-module color matrix calibration for spectral accuracy across light sources.
AE, AWB, color fidelity, tone mapping / gamma, noise reduction and sharpness iteration.
Objective lightbox tests (Imatest) plus subjective indoor / outdoor / video scene reviews.
Tuning profile per resolution mode + full IQ report; settings packaged for mass production.
on ISP EVM board
Establishes the measured baseline for each new sensor before any aesthetic tuning starts.
live preview
Where image quality is actually crafted — iterate parameters against live and captured scenes.
03 · The Setup
Every figure in this case study was captured under controlled, logged conditions in our IQ lab: standard light boxes, film-grade test charts and the instrument set below. The photographs in this section were taken on the actual lab bench used for Project D; purely conceptual diagrams on this page remain renderings.
from the lab test procedure · Imatest v5.1
| Test shot | Target | Light sources | Illuminance | Feeds (Imatest) |
|---|---|---|---|---|
| Color sweep | ColorChecker Classic (Macbeth) | D65 · CWF · TL84 · A · Horizon | 700 / 20 / 5 lux | ΔC00 · AWB error · SNR |
| Resolution | ISO 12233 chart (IT-10) | D65 | 700 / 20 lux | MTF50 H/V · oversharpening |
| Uniformity | Flat-field white target | D65 · CWF · TL84 · A · Horizon | 700 / 20 lux | Y-shading · color shading |
| Dynamic range | Kodak step chart | D65 | 700 / 20 lux | Dynamic range · tone response |
| Scene check | Lab scene + charts | color-temperature sweep | indoor levels | subjective color / noise review |

Six neutral patches measure SNR; the 18 color patches feed ΔC 2000 color error and AWB deviation under each light source — shot as a brightness sweep at 700 / 20 / 5 lux.

Denser sampling than the Classic: this is the target behind golden-module CCM calibration, where the color matrix is solved from many patches to stay accurate across the gamut — not just 24 points.

Hyperbolic wedges and square-wave sweeps yield MTF50 in both directions at center and corners, plus oversharpening — the chart behind every 0.3 c/p pass line in the results below.

A field of random-scale grey blobs — the standard pattern for measuring texture loss and noise-reduction smoothing, which no slanted-edge or sine chart can reveal.

Anchors exposure matching and white-balance reference between shots, between modules, and against the comparison device — the quiet tool that keeps every side-by-side honest.

Placed in the light path to hit exact lux set-points at the chart plane without changing the lamp spectrum — how 20-lux and 5-lux sweeps stay color-accurate.
Each objective shot from the recipe above, as it actually looks on the bench — source, lux and exposure logged with every frame.


lab inventory
| Instrument | Class | Role in the flow |
|---|---|---|
| Spectralight-QC (SPL-QC) | standard light box | Simulated daylight D65 6500K / D50 5000K; fluorescent TL84 4000K, CWF 4150K, U30 3500K; incandescent A 2855K; halogen; UV lamp |
| 3NH T90-7 | standard light box | LED D65 / D50 / A 2800K / UV; fluorescent U30 3000K, U35 3500K, TL84 4000K; halogen |
| SEKONIC C-7000 SpectroMaster | spectrometer | Spectral power distribution & CCT verification of every source before a measurement campaign |
| Pro’s Kit MT-4617 | LED light intensity meter | Illuminance calibration at the chart plane — the lux set-points in the recipe above |
| UNI-T UT390G · LH-130 | IR instruments | Infrared illumination measurement — IR-cut verification and IR-sensitive sensor work (e.g. DMS modules) |
| Imatest v5.1 + MATLAB · Photoshop · FastStone · 7YUV | analysis software | Objective IQ metrics, batch processing, RAW / frame inspection |
| Moving rail · tripod | mechanics | Repeatable camera–chart distance, height and parallelism between shots and modules |


04 · The Results
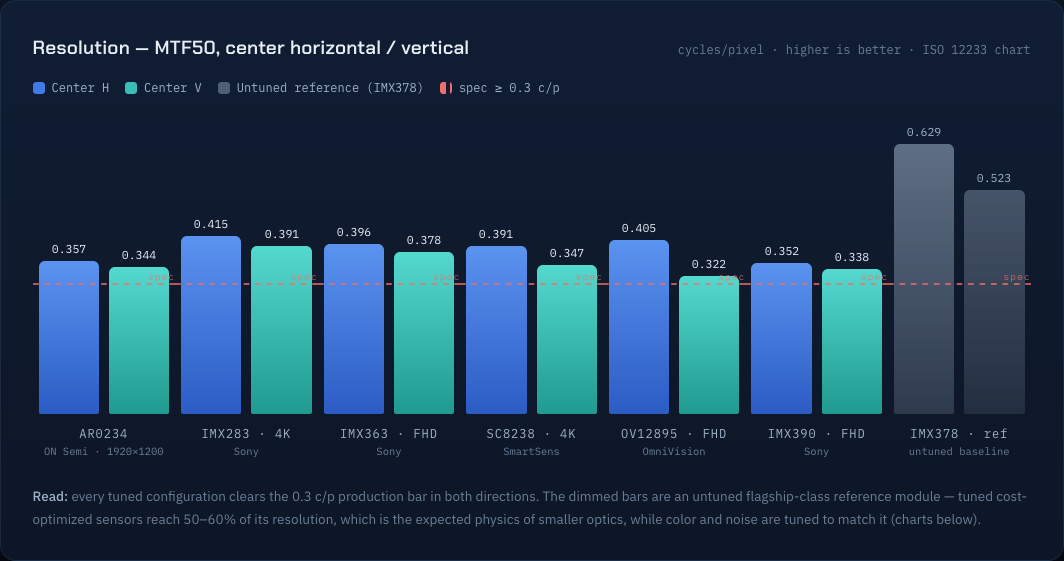
All figures below are post-tuning measurements from Project D’s verification reports — captured with Imatest v5.1 in a calibrated light-box lab (D65 6500K, TL84 4000K, CWF 4150K, A 2856K).
| Condition | Center H | Center V | Spec |
|---|---|---|---|
| AR0234 — ON Semi · 1920×1200 | 0.357 | 0.344 | |
| IMX283 · 4K — Sony | 0.415 | 0.391 | |
| IMX363 · FHD — Sony | 0.396 | 0.378 | |
| SC8238 · 4K — SmartSens | 0.391 | 0.347 | |
| OV12895 · FHD — OmniVision | 0.405 | 0.322 | |
| IMX390 · FHD — Sony | 0.352 | 0.338 | |
| IMX378 · ref — untuned baseline | 0.629 | 0.523 |
Read: every tuned configuration clears the 0.3 c/p production bar in both directions. The dimmed bars are an untuned flagship-class reference module — tuned cost-optimized sensors reach 50–60% of its resolution, which is the expected physics of smaller optics, while color and noise are tuned to match it (charts below).
lower is better · measured per CIE ΔC00
| Condition | IMX283 · 4K (Sony) | SC8238 · 4K (SmartSens) | OV12895 · FHD (OmniVision) | IMX390 · FHD (Sony) | Spec |
|---|---|---|---|---|---|
| D65 · 700lux | 4.57 | 3.34 | 3.55 | 3.38 | spec < 5 |
| CWF · 4150K | 4.48 | 3.70 | 4.33 | 4.08 | spec < 5 |
| TL84 · 4000K | 4.63 | 3.91 | 4.48 | 4.61 | spec < 5 |
| A · 2856K | 5.10 | 5.46 | 5.68 | 4.83 | spec < 8 |
Read: every tuned configuration stays under its light-source spec line. Incandescent light (A) is the hardest condition — spec relaxes to ΔC 2000 < 8 — and all four sensors still land between 4.8 and 5.7.
dB · higher is better · D65 source
| Condition | IMX283 · 4K (Sony) | SC8238 · 4K (SmartSens) | OV12895 · FHD (OmniVision) | IMX390 · FHD (Sony) | Spec |
|---|---|---|---|---|---|
| 500 lux | 43.6 | 39.2 | 44.3 | 45.7 | spec > 38 dB |
| 30 lux | 38.4 | 36.7 | 43.7 | 43.1 | spec > 33 dB |
| 20 lux | 40.5 | 35.0 | 41.0 | 41.1 | spec > 30 dB |
Read: at 20 lux — a dim restaurant, not full darkness — every tuned sensor keeps ≥ 35 dB, well above the 30 dB floor. That headroom is what separates “usable” from “clean” low-light video.
post-tuning measurements · Imatest v5.1
| Sensor · mode | MTF50 H/V (≥ 0.3 c/p) |
Overshoot worst (≤ 20%) |
ΔC00 mean D65 (< 5) |
SNR @500lx (> 38 dB) |
SNR @20lx (> 30 dB) |
Y-shading D65 corner |
AWB dev D65 (< 5) |
Verdict |
|---|---|---|---|---|---|---|---|---|
| IMX378 · reference (untuned) | 0.629 / 0.523 | 35% | 5.95 | 41.1 | — | 72.6% | 2.9 | baseline |
| AR0234 · 1920×1200 (ON Semi) | 0.357 / 0.344 | 7.6% | 3.87 | 46.0 | 36.3 | 99.1% | 1.4 | ✓ PASS |
| IMX283 · 3840×2160 (Sony) | 0.415 / 0.391 | 17.3% | 4.57 | 43.6 | 40.5 | 94.6% | 3.3 | ✓ PASS |
| IMX363 · 1920×1080 (Sony) | 0.396 / 0.378 | 16.2% | 3.22 | 45.5 | 41.0 | 87.0% | 2.7 | ✓ PASS |
| SC8238 · 3840×2160 (SmartSens) | 0.391 / 0.347 | 10.8% | 3.34 | 39.2 | 35.0 | 95.2% | 1.5 | ✓ PASS |
| OV12895 · 1920×1080 (OmniVision) | 0.405 / 0.322 | 6.5% | 3.55 | 44.3 | 41.0 | 97.4% | 1.4 | ✓ PASS |
| IMX390 · 1920×1080 (Sony) | 0.352 / 0.338 | 11.4% | 3.38 | 45.7 | 41.1 | 97.2% | 1.2 | ✓ PASS |
05 · Subjective Validation
Objective lightbox metrics are necessary but not sufficient. Every tuned configuration was also reviewed against a reference device under matched exposure, across the scene sets below — the same scenes end customers will actually shoot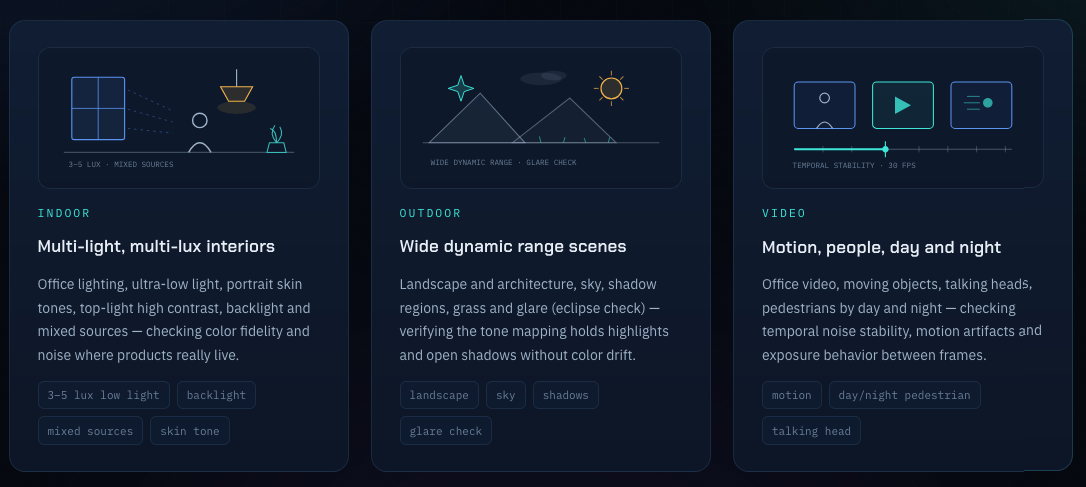
06 · The Team Behind It
Project D succeeded because the same playbook, equipment and acceptance gates exist for every customer engagement.

💡
🔬
📷
07 · ISP Tuning 101
A tuned ISP cannot rescue a bad lens. This is the gate we run before any module-level tuning starts: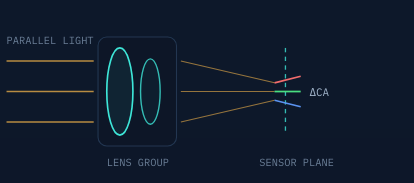
A sensor’s resolution has a hard physical limit set by pixel size. Two formulas tell you instantly whether a vendor’s LW/PH number is real: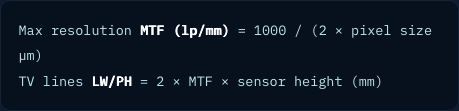
Worked example: a 1″-type 8 MP sensor with 3.92 µm pixels tops out at ≈128 lp/mm ≈ 2450 LW/PH. A datasheet claiming far beyond that is claiming past physics — a useful first filter when comparing modules.
Detection and recognition algorithms depend on stable, parseable images. Sensor noise disturbs feature extraction, color casts lower classification confidence, and uneven lens shading triggers false positives and missed detections. The real goal of ISP tuning is to keep the camera’s output inside the zone algorithms can reliably digest — in every environment, not just in the lab.
That is why this project was accepted on three dimensions, not one:
≥ 0.3 cycles/pixel
Spatial frequency where contrast drops to 50% — the standard resolution metric. Measured center and corners from ISO 12233 charts.
mean < 5 · D65
CIE color-difference between captured and reference ColorChecker patches, per light source. Lower = truer color.
> 38 dB @ 500 lux
Signal-to-noise ratio at defined illuminance levels — predicts how clean video looks as light drops.
corner mean ≈ 85%+ · D65
Brightness falloff toward image corners (vignetting) and its color version, corrected via LSC calibration.
< 5 ΔC units
How far auto white balance lands from neutral under each light source — the “orange/blue cast” metric.
08 · FAQ
ISP tuning calibrates and optimizes the Image Signal Processor parameters — black level, lens shading correction, white balance, color matrix, gamma, noise reduction and sharpening — so a camera module produces accurate, low-noise, natural images. Every sensor behaves differently, so factory-default parameters never deliver production-grade quality; each sensor-and-lens combination must be tuned individually.
For a mainstream image sensor, EyeCloud typically delivers a production-ready tuning profile and a full IQ verification report in 2–4 weeks, depending on resolution modes, lens options and custom scene requirements.
We have tuned sensors from Sony (IMX241/283/363/490/390/334), SmartSens (SC2232/2238/5335/8238/200AI), OmniVision (OV12895/2735/5645) and ON Semiconductor (AR0234), among others. The flow is sensor-agnostic and adapts to any CMOS sensor with RAW output.
Calibrated lab measurement with Spectralight SPL-QC and 3NH T90-7 light boxes (D65, D50, TL84, CWF, U30, A, Horizon), ISO 12233 charts, X-Rite ColorChecker Classic & SG, grey cards, ND filters and a SEKONIC C-7000 spectrometer, with illuminance and IR verification by Pro's Kit MT-4617, UNI-T UT390G and LH-130 meters. Analysis uses Imatest, against written criteria such as MTF50 ≥ 0.3 c/p, ΔC00 mean < 5 (D65) and SNR > 38 dB @ 500 lux.
(1) A production-ready ISP tuning profile for every resolution mode, (2) production calibration settings — lens shading, white point, AF, golden-module CCM — and (3) a full IQ verification report combining objective measurements with subjective scene samples.
Objectively: Macbeth color sweeps at 5/20/700 lux, ISO 12233 resolution charts, flat-field shading across five light sources and Kodak step-chart dynamic range — all with recorded, repeatable conditions. Subjectively: reviewed scenes across indoor, outdoor and video sets — ultra-low light, backlight, mixed lighting, skin tones, moving objects.
Need production-grade image quality on your sensor?
Send us your sensor and lens stack — we’ll return a tuning plan, timeline and acceptance criteria within a week.
Talk to the team behind this program about your calibration, tuning and IQ verification needs.
Book a Tuning Consultation →
